
After you create a point-plotting function, the next obvious graphical function to code is the line. Whether you’re graphing in text mode or using pixels, you’ll quickly find that two conditions exist where a line function just can’t draw a line.
These two conditions are for the vertical and horizontal lines. Seems rather basic, right?
I’ve modified the code from last week’s Lesson to draw a vertical line by changing Line 22 in the code to read:
line(5,8,5,-8);
I’d show you the output, but none exists; only an empty canvas grid is displayed.
Likewise, a horizontal line won’t show up when you try this function:
line(-10,8,10,8);
Nada.
The reason no line is drawn is because the slope calculation contains a zero: When the change in y is zero, the slope is 0/Δx. And when the change in x is zero, the slope is Δy/0, which is undefined. (Honestly, I’m surprised the program doesn’t puke all over itself.)
To properly code these two conditions, you must supply a pair of exceptions to the line() function. I call them the horzline() and vertline() functions, which you see in the following code.
#include <stdio.h>

#define WIDTH 60
#define HEIGHT 20
#define X WIDTH/2
#define Y HEIGHT/2
#define XMAX WIDTH-X-1
#define XMIN -(WIDTH-X)
#define YMAX HEIGHT-Y
#define YMIN -(HEIGHT-Y)+1

char grid[HEIGHT][WIDTH];

int line(int x1, int y1, int x2, int y2);
int horzline(int x1, int x2, int y);
int vertline(int x, int y1, int y2);
int plot(int x, int y);
void init_grid(void);
void show_grid(void);

int main()
{
    init_grid();
    line(-4,3,3,-5);
    line(-20,-5,20,-5);
    line(-20,-9,20,9);
    show_grid();

    return(0);
}

/* draw a line from point x1,y1 to x2,y2 */
int line(int x1, int y1, int x2, int y2)
{
    int x,deltaY,deltaX;
    float slope,y;

    /* Calculate the slope */
    deltaY=(Y-y1)-(Y-y2);       /* Calculate using absolute */
    deltaX=(X+x2)-(X+x1);       /*  coordinates */
    slope=(float)deltaY/(float)deltaX;

    /* check for certain exceptions */
    if( y1 == y2 )          /* line is flat */
    {
        horzline(x1,x2,y1);
        return(1);
    }
    if( slope > X)          /* line is too steep */
    {
        vertline(x1,y1,y2);
        return(1);
    }

    /* Plot the points on the line */
    x = x1;
    y = (float)y1;
    while( x!=x2 && (int)y!=y2)
    {
        plot(x,(int)y);
        y += slope;
        if( x1 < x2 )
            x++;
        if( x1 > x2 )
            x--;
    }
    return(1);
}

/* Draw Horizontal Line */
int horzline(int x1, int x2, int y)
{
    int x;

    for(x=x1;x<=x2;x++)
        plot(x,y);

    return(1);
}

/* Draw Vertical Line */
int vertline(int x, int y1, int y2)
{
    int y;

    for(y=y1;y<=y2;y++)
        plot(x,y);

    return(1);
}

/* Set "pixel" at specific coordinates */
int plot(int x, int y)
{
    if( x > XMAX || x < XMIN || y > YMAX || y < YMIN )
        return(-1);

    grid[Y-y][X+x] = '*';
    return(1);
}

/* Initialize grid */
void init_grid(void)
{
    int x,y;

    for(y=0;y<HEIGHT;y++)
        for(x=0;x<WIDTH;x++)
            grid[y][x] = ' ';
    /* draw the axis */
    for(y=0;y<HEIGHT;y++)
        grid[y][X] = '|';
    for(x=0;x<WIDTH;x++)
        grid[Y][x] = '-';
    grid[Y][X] = '+';
}

/* display grid */
void show_grid(void)
{
    int x,y;

    for(y=0;y<HEIGHT;y++)
    {
        for(x=0;x<WIDTH;x++)
            putchar(grid[y][x]);
        putchar('\n');
    }
}
That’s a lot of code, but really it includes only a new version of the line() function plus the addition of the horzline() and vertline() functions, and their prototypes.
The output is shown in Figure 1.
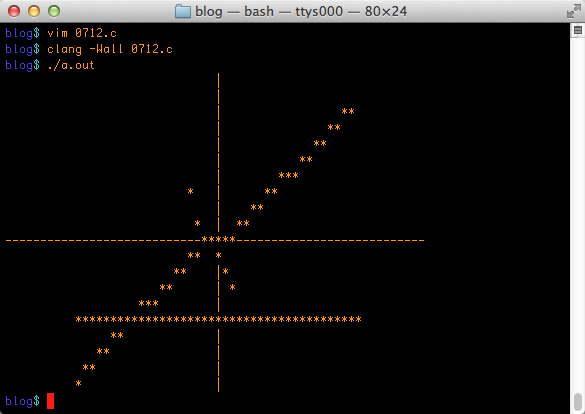
Figure 1. Three lines are drawn, including a horizontal line.
Line 44 checks to see whether the line is flat, or horizontal. If so, the horzline() function is run.
Line 49 checks to see whether the line is too steep, or vertical. If so, the vertline() function is run.
Both the horzline() and vertline() function draw a straight line. Each uses a for loop and the plot() function; no slope calculation is needed.
Together, the line(), vertline(), and horzline() functions completes the line-plotting tools necessary for text-mode graphics. Another function you could craft would be the box() function, which draws a rectangle between two sets of coordinates, using the same arguments as the line() function. Feel free to code that one on your own.
After lines come curves. In the next Lesson, I’ll demonstrate a function that draws curves by using text mode graphics; all you need is the plot() function — and some trigonometry.