
Circles are easy to draw by hand, especially when you have a compass. On a computer, the Circle tool is common in graphics programs, although it’s really the Ellipse tool. And when programming, well, you’ll have to plot your own circle — especially when pulling a stunt like drawing graphics in text mode.
Unlike a simple wave, the C library holds no mathematical formula for plotting a circle. Instead, as with plotting a line, you have embrace the raw mathematical formula for a circle, which is:
x² + y² = r
Variables x and y are the circle’s coordinates. Variable r represents the radius or, more precisely, the square root of r is the radius. Figure 1 illustrates a basic circle plotted using the Grapher program on the Macintosh.
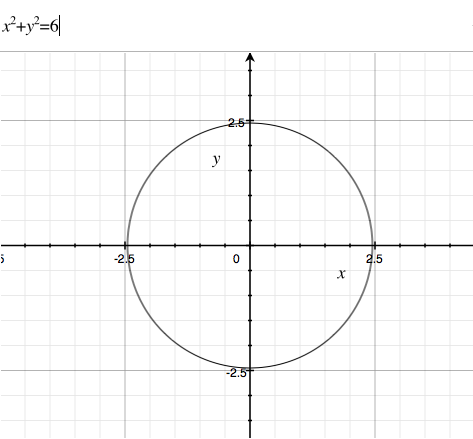
Figure 1. The circle formula.
If you’re going to plot coordinates from left to right on the Cartesian plane, you need to solve the circle equation for y. By my math memory, that would be:
y = √r-x²
A mathematician would cringe at that solution, because it’s kinda wrong: If you plot that equation, you get only the top half of the circle. To get the bottom half you also have to take into account negative values of y. That’s okay, because all you need to plot a circle on a computer is the top half anyway, as the following code demonstrates.
#include <stdio.h>
#include <math.h>
#include <stdlib.h>

#define WIDTH 60
#define HEIGHT 20
#define X WIDTH/2
#define Y HEIGHT/2
#define XMAX WIDTH-X-1
#define XMIN -(WIDTH-X)
#define YMAX HEIGHT-Y
#define YMIN -(HEIGHT-Y)+1

char grid[HEIGHT][WIDTH];

int circle(int x, int y, int radius);
int plot(int x, int y);
void init_grid(void);
void show_grid(void);

int main()
{
    init_grid();
    circle(0,0,8);
    show_grid();

    return(0);
}

/* Plot a circle */
int circle(int x, int y, int radius)
{
    float xpos,ypos,radsqr,xsqr;

    for(xpos=x-radius;xpos<=x+radius;xpos+=0.1)
    {
        radsqr = pow(radius,2);
        xsqr = pow(xpos,2);
        ypos = sqrt(abs(radsqr - xsqr));
        plot(rintf(xpos),rintf(ypos));
        plot(rintf(xpos),rintf(-ypos));
    }

    return(1);
}

/* Set "pixel" at specific coordinates */
int plot(int x, int y)
{
    if( x > XMAX || x < XMIN || y > YMAX || y < YMIN )
        return(-1);

    grid[Y-y][X+x] = '*';
    return(1);
}

/* Initialize grid */
void init_grid(void)
{
    int x,y;

    for(y=0;y<HEIGHT;y++)
        for(x=0;x<WIDTH;x++)
            grid[y][x] = ' ';
    /* draw the axis */
    for(y=0;y<HEIGHT;y++)
        grid[y][X] = '|';
    for(x=0;x<WIDTH;x++)
        grid[Y][x] = '-';
    grid[Y][X] = '+';
}

/* display grid */
void show_grid(void)
{
    int x,y;

    for(y=0;y<HEIGHT;y++)
    {
        for(x=0;x<WIDTH;x++)
            putchar(grid[y][x]);
        putchar('\n');
    }
}
The circle() function plots the circle by using the equation y = √r-x². Here’s how that breaks down, starting at Line 35:
for(xpos=x-radius;xpos<=x+radius;xpos+=0.1)
The for loop marches along the x axis based on the radius argument. I use the full value of radius here, so I’m not exactly following the formula. That’s okay; the circle() function asks for a radius value and not the square root of that value. Also, the stepping value is 0.1, which ensures that something more-or-less resembling a circle is drawn.
Lines 37 and 38 obtain the square of the radius and xpos variables by using the pow() function:
radsqr = pow(radius,2);

xsqr = pow(xpos,2);
I didn’t have to use the radsqr or xsqr variables; these could have been calculated on the next line, but doing so makes that statement rather messy. Also, you could use radius*radius instead of pow(radius,2), but I prefer using the pow() function. Remember: Unlike other programming languages, C lacks a power operator.
Line 39 calculates the y position by using the formula y = √r-x²:
ypos = sqrt(abs(radsqr - xsqr));
The abs() function calculates the absolute value (positive numbers only) of radsqr minus xsqr. It’s necessary because that value could be negative, which would cause the sqrt() function to squirt all over the compiler. And because this formula returns only positive values (the top of the circle), the next two plot() statements (Lines 40 and 41) must plot both positive and negative values of ypos:
plot(rintf(xpos),rintf(ypos));

plot(rintf(xpos),rintf(-ypos));
And the circle is drawn. Sample output is shown in Figure 2. Yes, it’s an oval, which is due to the proportions of single characters in text mode graphics. (See if you can figure out how to compensate for that in the code!)
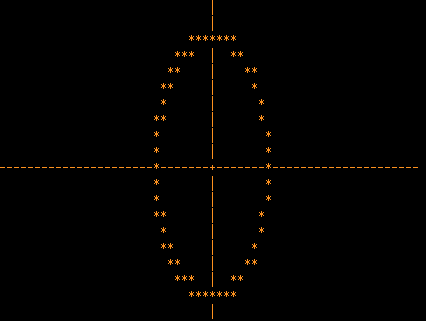
Figure 2. The circle is plotted by using text mode graphics.
The problem?
Oh, yeah: Come on, you knew that there would be a problem!
The current rendition of the circle() function assumes a focus of 0,0. If you want to plot the center of the circle at location 3,8, you need to modify the circle() function, specifically Lines 38, 40, and 41. Here’s the revised circle() function:
/* Plot a circle */
int circle(int x, int y, int radius)
{
    float xpos,ypos,radsqr,xsqr;

    for(xpos=x-radius;xpos<=x+radius;xpos+=0.1)
    {
        radsqr = pow(radius,2);
        xsqr = pow(xpos-x,2);
        ypos = sqrt(abs(radsqr - xsqr));
        plot(rintf(xpos),rintf(ypos)+y);
        plot(rintf(xpos),rintf(-ypos)+y);
    }

    return(1);
}
Or you can click here to download the full source code file.