In last week’s Lesson, the Code::Blocks debugger helped examine the values of two variables, short int a and short int pointer p. Pointer p revealed a memory location inside the computer, which you can examine by using Code::Block’s Memory dump window.
Open the project Peeks and Pokes, which was created in last week’s Lesson.
Click the mouse to the right of Line 8, shown in Figure 1 (blue), to place a stop at that line.
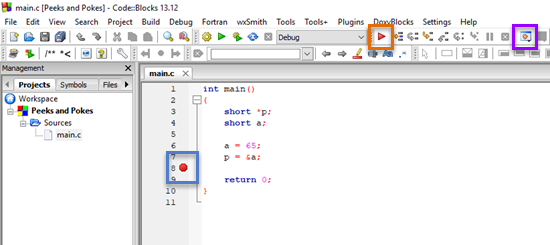
Figure 1. This Lesson’s code in Code::Blocks. The stop icon is outlined with a blue square; the Debug/Continue button in orange; the Debugging Windows button in purple.
Click the Debug/Continue button (orange), to run the code to that point.
Click the Debugging Windows button, outlined in purple in Figure 1, and choose Watches. You see the code’s two variables, p and a. At this point in the code, both variables are assigned values, which appear in the Watches window, similar to what’s shown in Figure 2.
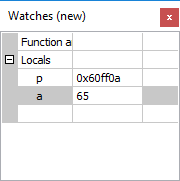
Figure 2. The debugging window Watches lists the values assigned to the program’s variables.
Being a pointer, variable p lists memory location 0x60ff0a in Figure 2. This location, which differs from system to system, is part of the chunk of memory the operating system allocated to the program, so it’s safe to use.
To view the memory location’s contents, click the Debugging Windows button again and choose Memory Dump. Into the Address box, type p (the pointer variable name). Because p holds a memory address, you see a dump of that memory’s location, similar to what appears in Figure 3.
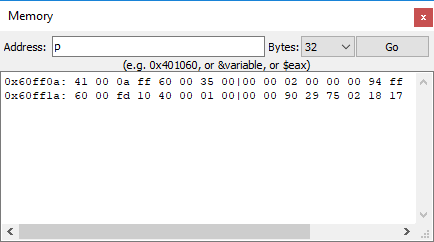
Figure 3. The memory dump of the address stored in variable p.
A short int on my computer system occupies two bytes. The first two bytes stored at address 0x60ff0a are 41 and 00. These correspond to the value 65 (decimal) of variable a. Yes, for very nerdy reasons, integer values appear in memory in reverse order, least significant byte first (LSB) followed by most significant byte (MSB). Don’t worry: It works.
To brush up on your pointer knowledge, variable p is assigned to the memory location of variable a. So what you really see in the Memory window is where the computer has stored variable a. Variable p has its own location (accessed as &p), which I’m going to avoid talking about now. But, as a pointer, p holds the address of variable a, known here as 0x60ff0a, and *p “peeks” at the value, which is 0x41 or 65 decimal.
Click the Stop button to exit the debugger (if necessary) and close the various debugging windows.
Modify the code so that *p changes the value of variable a: After Line 7, add a new line 8:
*p = 0x1234;
Save the change and compile the code, but don’t run. (The code has no output.)
As you did before, place the Stop at Line 8 and click the Debug/Continue button to run to that point.
Open the Watches window and the Memory Dump window. Each should show values you’ve seen before. And feel free to move the windows about to better see everything.
 Click the Next Line button, which is shown to the left.
The Watches window updates to reflect the new value of variable a, 4660. You also see the Memory dump window reflect the new value as well, stored as two byte, 34 and 21, in LSB, MSB order. That’s how you poke.
In next week’s Lesson, I’ll show how an integer array looks in memory, and how pointer math moves the pointer variable in specific increments to access memory locations.