C language pointers are smarter than the old BASIC peek and poke commands. A pointer knows the the type of value it’s referencing in memory, specifically how large the value is or how many bytes of storage it occupies. You can use the Code::Blocks debugger to witness such pointer intelligence.
Start a new Console project in Code::Blocks, for the C language, and name it Integer Array. Ensure that you create a Debug configuration for the project. Set this code for main.c:
#include <stdio.h>
#include <stdlib.h>

int main()
{
    int array[5],x,*ptr;

    for(x=0;x<5;x++)
        array[x] = x*2;

    ptr = array;
    for(x=0;x<5;x++)
        ptr++;

    return(0);
}
An int array[] is created and filled with values. Pointer ptr is assigned to array[], then incremented through the array. Nothing is output — yet.
Compile the code; you don’t need to run it as it lacks output. Instead, place a stop at Line 12, the second for statement. Refer to last week’s Lesson for details on setting a stop and stepping through code.
Click the Debug/Continue button. The code runs to Line 12.
Click the Debugging Windows button and choose Watches. In the Watches window, expand the array variable to view its five values, as shown in Figure 1. You also see the value of x: 5 after the previous for loop. The value of ptr is set to the location of array in memory.
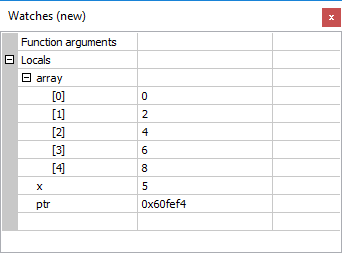
Figure 1. Values of variables in the code, as shown in the Debugger’s Watches window.
To view the array as stored in memory, click the Watches button and choose Memory Dump. In the Memory window’s Address box, type ptr, the name of the pointer variable that references array[]‘s location in memory. The specific address varies, but you should see something similar to what’s shown in Figure 2.
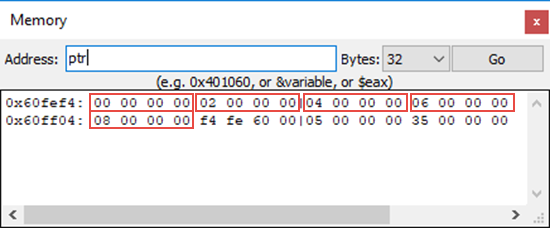
Figure 2. The array stored in memory.
On my computer, int values are stored as a four-byte sequence. Each element of the array in memory is outlined in red in Figure 2. Values are stored with the least significant byte first, so you see 0, 2, 4, 6, and 8, but also a lot of zeros to pad out the full four-bytes of memory.
With both Watches and Memory windows open, click the Step Into button on the Debugger toolbar, illustrated in Figure 3.

Figure 3. The Step Into button.
You see the value of x change to 0, as directed in the for loop. The value of ptr is unchanged, but click the Step Into button again.
On my computer, the ptr value changed from 0x60fef4 to 0x60fef8, an increase of 4 bytes, which references the second array element in memory. Indeed, if you check the Memory window, you see that ptr‘s memory dump is updated and the first value shown is 02 00 00 00.
As you keep clicking the Step Into button, you see both variables x and ptr increment, as well as the results in the Memory window shift over 4 bytes. The process you’re witnessing is how an int pointer steps through an array stored in memory.
Because the sizeof(int) on my system is 4 bytes, an int pointer knows to skip through memory four bytes at a time. In fact, if I were to perform the math ptr+10, the memory location stored in ptr is increased by 40 bytes. That’s how pointer math works. And having a debugging window show you what’s going on in memory really helps to understand the process.