Difficulty: ★ ★ ☆ ☆
Even when statistics has barely brushed by you on the subway, you probably know the term standard deviation. It refers to how data is distributed in a group, their distance from the mean. You can use your C programming kung fu to code the standard deviation of a data set, which is the challenge for this month’s Exercise.
Before marching naked into the unforgiving jungle of statistics, here are some terms to know:
- mean The sum of the values in a set divided by the number of values, symbol μ. The mean is what most people refer to when they say “average.”
- median The value in the middle of a set of sorted numbers. The median of {2, 3, 6, 10, 20} is 6.
- mode The value that appears most frequently in a set. The mode of {2, 3, 4, 4, 4, 10} is 4.
- average A single value that best represents a set. It could be the mean (arithmetic mean) but can also be a value that isn’t mathematically the mean.
- standard deviation The measure of variation from the mean, symbol σ. The higher the standard deviation, the more atypical the data point.
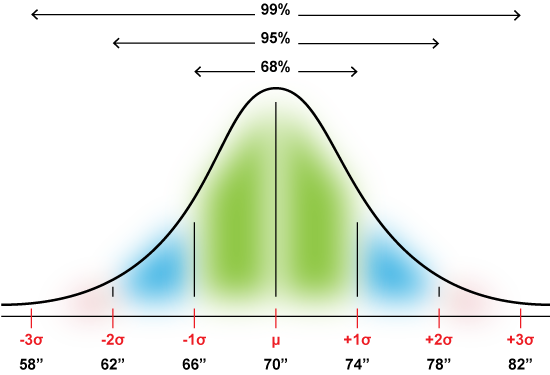
As an example, say that the mean height for a group of adult men is 5’10”, or 70 inches tall. Values shorter or taller than the mean are graphed out as shown in Figure 1, which forms the classic bell curve.

Figure 1. Distribution for adult male heights, along with standard deviation values.
In the Figure, each standard deviation from the mean is four inches: A man 78″ tall (6’6″) is two standard deviations from the norm. A man who is 58″ tall (4’10”) is three standard deviations away. If a man is 72″ tall, he’s within the first standard deviation, representing 68 percent of all heights in the group.
To calculate the standard deviation, you obey these steps:
- Calculate the mean for the values.
- Calculate the deviation from the mean for each value and square the result.
- Calculate the mean of the results, which is a value called the variance.
- The square root of the variance is the standard deviation.
The ugly formula for calculating the standard deviation is shown in Figure 2. It’s used when data is available for the entire population, know as the Population Standard Deviation. A different formula is used when you have only a sample of the entire population.

Figure 2. The mathematical monster used to calculate standard deviation (full set).
In Figure 2, N is the number of items in the set, the data points. xi represents each data point. μ is the mean. The result is σ, the standard deviation. You total the items in the set, subtracting each from the mean (the deviation) and squaring the results. This total is divided by the number data points, N, to obtain the variance. The square root of the variance is the standard deviation.
Your challenge for this month’s Exercise is to calculate the standard deviation for the data set presented in the sample code. Specifically, you’re to write the stddev() function referenced.
2024_05_01-Lesson.c
#include <stdio.h>

/* whole population calculation */
double stddev(int v[],int items)
{
}

int main()
{
    int values[] = { 10, 12, 23, 23, 16, 23, 21, 16 };
    int x,items;

    /* output the array's values */
    items = sizeof(values)/sizeof(int);
    printf("Values:");
    for( x=0; x<items; x++ )
    {
        printf(" %2d",values[x]);
    }
    putchar('\n');

    printf("The standard deviation is %.4f\n",
            stddev(values,items)
          );

    return 0;
}
Here’s a sample run from my solution:
Values: 10 12 23 23 16 23 21 16

The standard deviation is 4.8990
Please try this exercise on your own before you peek at my solution.