
Continuing from last week’s Lesson, my goal for the grid is to split it into chunks which are then reduced based on the average value of each chunk. To best visualize this, I’d like to keep the byte patterns in the grid consistent and — as a bonus — color-code them.
The following code generates a grid with dimensions ROWS by COLUMS. Each item in the grid is coded by row and column. The grid is output as it’s stored:
2026_04_11-Lesson-a.c
#include <stdio.h>

#define ROWS 16
#define COLUMNS 16
#define AREA ROWS*COLUMNS

int main()
{
    unsigned char grid[AREA];
    int x,y;

    for( y=0; y<ROWS; y++ )
    {
        for( x=0; x<COLUMNS; x++ )
        {
            grid[x] = x;
            printf("%02X ",x);
        }
        putchar('\n');
    }

    return 0;
}
Nested for loops generate the grid’s contents, assigning elements to the grid and outputting them one row at a time:
00 01 02 03 04 05 06 07 08 09 0A 0B 0C 0D 0E 0F
00 01 02 03 04 05 06 07 08 09 0A 0B 0C 0D 0E 0F
00 01 02 03 04 05 06 07 08 09 0A 0B 0C 0D 0E 0F
00 01 02 03 04 05 06 07 08 09 0A 0B 0C 0D 0E 0F
00 01 02 03 04 05 06 07 08 09 0A 0B 0C 0D 0E 0F
00 01 02 03 04 05 06 07 08 09 0A 0B 0C 0D 0E 0F
00 01 02 03 04 05 06 07 08 09 0A 0B 0C 0D 0E 0F
00 01 02 03 04 05 06 07 08 09 0A 0B 0C 0D 0E 0F
00 01 02 03 04 05 06 07 08 09 0A 0B 0C 0D 0E 0F
00 01 02 03 04 05 06 07 08 09 0A 0B 0C 0D 0E 0F
00 01 02 03 04 05 06 07 08 09 0A 0B 0C 0D 0E 0F
00 01 02 03 04 05 06 07 08 09 0A 0B 0C 0D 0E 0F
00 01 02 03 04 05 06 07 08 09 0A 0B 0C 0D 0E 0F
00 01 02 03 04 05 06 07 08 09 0A 0B 0C 0D 0E 0F
00 01 02 03 04 05 06 07 08 09 0A 0B 0C 0D 0E 0F
00 01 02 03 04 05 06 07 08 09 0A 0B 0C 0D 0E 0F
With the grid’s data organized in this manner it’s easier for me to confirm how the chunks are split. But what would be even better is to color-code the chunks.
Color output at the terminal is made possibly by applying ANSI codes to standard output. While I code define these codes as I’ve done in other source code files, here I can take advantage of the x looping value to apply different colors to the grid. The following code shows this update:
2026_04_11-Lesson-b.c
#include <stdio.h>

#define ROWS 16
#define COLUMNS 16
#define AREA ROWS*COLUMNS
#define NORMAL "\e[m"

int main()
{
    unsigned char grid[AREA];
    int x,y;

    for( y=0; y<ROWS; y++ )
    {
        for( x=0; x<COLUMNS; x++ )
        {
            grid[x] = x;
            if( y<8 )
                printf("\e[3%cm%02X%s ",(x/4+1)+'0',x,NORMAL);
            else
                printf("\e[3%cm%02X%s ",(x/4+5)+'0',x,NORMAL);
        }
        putchar('\n');
    }

    return 0;
}
The specific color code values are listed in this post from 2022. The escape sequences appear in the printf() statements. The specific color code is calculated by dividing the x value by four and then adding one: (x/4+1) or adding five for the second row: (x/4+5)
The program’s output generates a grid with eight distinct color areas, as shown here:
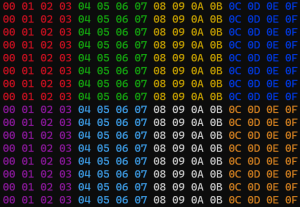
Figure 1. The colorful grid output.
With the grid divided into eight regions, my next task is to separate the regions. The goal is to handle the grid as eight separate chunks, each of which can be evaluated. I cover this process in next week’s Lesson.