
Solution for Exercise 11-15
ex1115
#include <stdio.h>
#include <math.h>

#ifndef M_PI
#define M_PI 3.14159
#endif

int main()
{
    const float amplitude=70, wavelength=0.1;
    float graph,s,x;

    for(graph=0;graph<M_PI;graph+=wavelength)
    {
        s = sin(graph);
        for(x=0;x<s*amplitude;x++)
            putchar('*');
        putchar('\n');
    }
    return(0);
}
Output
*******
**************
*********************
****************************
**********************************
****************************************
**********************************************
***************************************************
*******************************************************
***********************************************************
***************************************************************
******************************************************************
********************************************************************
*********************************************************************
**********************************************************************
**********************************************************************
**********************************************************************
*********************************************************************
*******************************************************************
****************************************************************
*************************************************************
*********************************************************
*****************************************************
************************************************
******************************************
*************************************
******************************
************************
*****************
**********
***
Notes
* Don't sweat it if the trigonometry in this code boggles you.
* Here is the graphical representation of a sine wave:
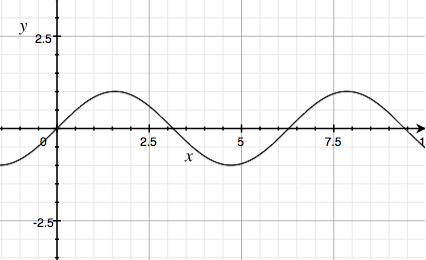
* The constant M_PI is required because the C language trig functions deal with radians, not degrees. So in Line 14, the for loop goes from zero to M_PI radians, which is half a circle.
* Refer to my information on preprocessor directives if you'd like to know more about #ifndef.
* You can make adjustments to the code by changing a few of the key values. I've defined those values as constants, which makes them easier to change:
* The constant amplitude sets the height of the graph (left-to-right) as measured by screen columns. To make the graph more squat, change the value to something smaller. The wavelength constant is related to the number of rows in the output.
Copyright © 1997-2026 by QPBC.
All rights reserved