Generating a table where the items march left-to-right and then down the page is uncomplicated with stream output. What’s more difficult is outputting a table where the data drops in columns top-down before going left-to-right. Performing this feat requires no screen/cursor manipulation, only clever coding.
The key to getting the output correct is to know two tidbits about the data: the total number of items and either the rows or columns desired. You must calculate the grid size, then output values in the stream to fill the table.
When given the number of values to output and columns desired, I calculate the rows as: rows = values/columns+1 The +1 ensures that the final row is output given that these are integer values.
In last week’s Lesson, the calculation made to generate a left-to-right table is: (x*columns)+y) For the top-to-bottom table, the calculation is x+(y*rows) — almost the opposite construction. The code from the previous Lesson must be modified further because the blank items appear at the end of a row, not at the bottom of a column.
2022_09_17-Lesson.c
#include <stdio.h>

int main()
{
    const int columns = 9;
    const int values = 100;
    int x,y,rows,count,v;

    x = 0;                /* track the rows */
    count = values;
    rows = values/columns+1;    /* how many rows are needed, max? */
    while( x<rows )
    {
        /* in stream output, columns alway appear first */
        for( y=0; y<columns; y++ )
        {
            /* calculate the value to output */
            v = x+(y*rows);            /* this value could also be
                                       an array element number */
            if( v<values )            /* output only numbers in range */
            {
                printf("%3d",v);
                count--;                /* decrement the count */
                if( !count )            /* if count is zero, stop */
                    break;
            }
            if( y<columns-1)            /* set tabs between numbers */
                putchar('\t');
        }
        x++;
        putchar('\n');
    }


    return(0);
}
Constants for the columns and number of values are set as shown on Lines 5 and 6. Play with these numbers to generate different size table arrangements.
As with last week’s example, rows are output first as stream output works left-to-right regardless of how the table’s contents lay out. The while loop handles rows with the for loop going across with column values.
The value output is within the range of zero through constant values. It’s calculated at Line 18 as: v = x+(y*rows). The current row is added to the column value multiplied by the total number of rows. This expression works out how the column values jump across the table, as shown in the output in Figure 1.
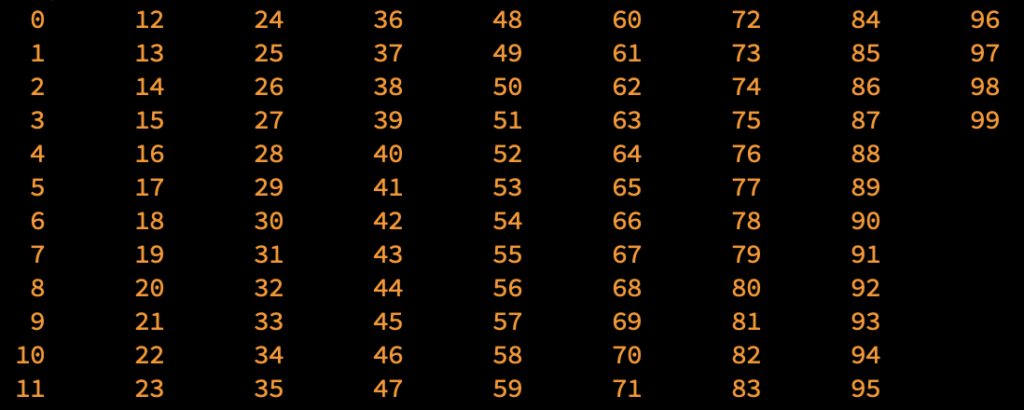
Figure 1. The table’s values march down rows first, then across columns.
The if test at Line 20 ensures that the final column doesn’t overflow. If the value calculated v is less than the total values, the value is output and the total count is decremented. You can see when this condition is trigged in Figure 1, no value to the right of 88 appears in the fifth row, and on down the final column.
Remember that value can be an index into a buffer or the element number in an array. This is how data collected can be output in a top-down column table without offending stream output’s left-to-right way of doing things.
I find this type of table arrangement to be more impressive than last week’s example and the code presented for this month’s Exercise. Face it, left-to-right tables aren’t difficult to generate with stream output. This top-to-bottom table raises the bar, but it’s possible only when you know the total number of items and the column or row count.