In text mode graphics, a char buffer serves as the drawing board, allowing you to plot x and y coordinates. Before any plotting takes place, however, you need a proper canvas.
Rather than create a simply x, y grid, I’m going to build a buffer based on Cartesian coordinates: Position 0,0 will be at the center of the grid. That location makes it easier to plot geometric shapes like circles and waves (which I’ll demonstrate in a future Lesson).
The following code sets up such a Cartesian coordinate system:
#include <stdio.h>

#define WIDTH 60
#define HEIGHT 20
#define X WIDTH/2
#define Y HEIGHT/2

int main()
{
    char grid[HEIGHT][WIDTH];
    int x,y;

/* Initialize grid */
    for(y=0;y<HEIGHT;y++)
        for(x=0;x<WIDTH;x++)
            grid[y][x] = ' ';
    /* draw the axis */
    for(y=0;y<HEIGHT;y++)
        grid[y][X] = '|';
    for(x=0;x<WIDTH;x++)
        grid[Y][x] = '-';
    grid[Y][X] = '+';

/* display grid */
    for(y=0;y<HEIGHT;y++)
    {
        for(x=0;x<WIDTH;x++)
            putchar(grid[y][x]);
        putchar('\n');
    }

    return(0);
}
Constants X and Y define the axes. A line is drawn horizontally and vertically, and a + (plus character) is inserted at the center. Figure 1 details the output.
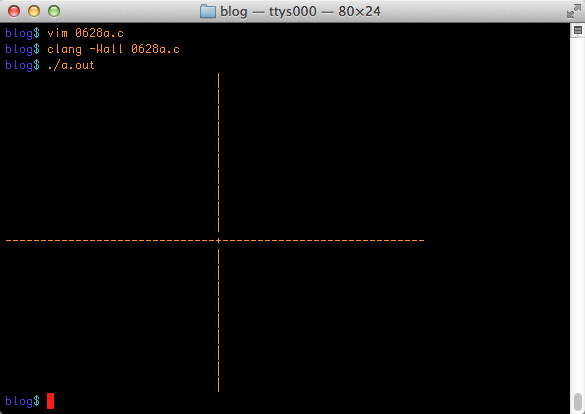
Figure 1. The canvas sports X and Y axes.
A better way to write the code would be to have the initialize grid and display grid routines banished to their own functions. I’ve done that in the following code, which is merely an update to the first example:
#include <stdio.h>

#define WIDTH 60
#define HEIGHT 20
#define X WIDTH/2
#define Y HEIGHT/2

char grid[HEIGHT][WIDTH];

void init_grid(void);
void show_grid(void);

int main()
{
    init_grid();
    show_grid();

    return(0);
}

/* Initialize grid */
void init_grid(void)
{
    int x,y;

    for(y=0;y<HEIGHT;y++)
        for(x=0;x<WIDTH;x++)
            grid[y][x] = ' ';
    /* draw the axis */
    for(y=0;y<HEIGHT;y++)
        grid[y][X] = '|';
    for(x=0;x<WIDTH;x++)
        grid[Y][x] = '-';
    grid[Y][X] = '+';
}

/* display grid */
void show_grid(void)
{
    int x,y;

    for(y=0;y<HEIGHT;y++)
    {
        for(x=0;x<WIDTH;x++)
            putchar(grid[y][x]);
        putchar('\n');
    }
}
The code’s output is the same, but by creating the init_grid() and show_grid() functions, it makes it easier to read the code as well as to modify it in the future.
The grid by itself is lonely. What it needs is a basic graphics function. Below, I’ve added the plot() function, which places a character (hard-coded as an asterisk) at a specific x, y position in the grid. Negative coordinates can be used, plus I added some bounds checking to ensure that nothing is plotted off the grid.
#include <stdio.h>

#define WIDTH 60
#define HEIGHT 20
#define X WIDTH/2
#define Y HEIGHT/2
#define XMAX WIDTH-X-1
#define XMIN -(WIDTH-X)
#define YMAX HEIGHT-Y
#define YMIN -(HEIGHT-Y)+1

char grid[HEIGHT][WIDTH];

int plot(int x, int y);
void init_grid(void);
void show_grid(void);

int main()
{
    init_grid();
    plot(-3,-3);
    plot(XMIN,YMIN);
    plot(XMAX,YMIN);
    plot(XMIN,YMAX);
    plot(XMAX,YMAX);
    show_grid();

    return(0);
}

/* Set "pixel" at specific coordinates */
int plot(int x, int y)
{
    if( x > XMAX || x < XMIN || y > YMAX || y < YMIN )
        return(-1);

    grid[Y-y][X+x] = '*';
    return(1);
}

/* Initialize grid */
void init_grid(void)
{
    int x,y;

    for(y=0;y<HEIGHT;y++)
        for(x=0;x<WIDTH;x++)
            grid[y][x] = ' ';
    /* draw the axis */
    for(y=0;y&tl;HEIGHT;y++)
        grid[y][X] = '|';
    for(x=0;x<WIDTH;x++)
        grid[Y][x] = '-';
    grid[Y][X] = '+';
}

/* display grid */
void show_grid(void)
{
    int x,y;

    for(y=0;y<HEIGHT;y++)
    {
        for(x=0;x<WIDTH;x++)
            putchar(grid[y][x]);
        putchar('\n');
    }
}
The plot() function starts at Line 32. First the coordinates are checked against the grid’s bounds (Line 34). Because constants are used, you can re-size the grid by changing the WIDTH and HEIGHT constants and not have to fuss with any further code modifications.
The result of the bounds checking is that if the coordinate plotted is outside the grid, the function returns -1. Otherwise, the position in the grid is plotted at Line 37. Remember that negative and positive coordinates can be used, which you see when the code is run; the output is shown in Figure 2.

Figure 2. A “pixel” is placed at all four corners of the grid, plus another at position -3, -3.
The “pixel” at -3, -3 isn’t exactly plotted equidistant, as it would be when using true Cartesian coordinates. That’s due to the width/height ratio of a character in text mode. Still, it worked!
The plot() function is the basis for all graphics output. By using it, you can concoct other functions to create text-mode graphics. I’ll show you more next Lesson.