So far in my text mode graphics demonstration, I’ve shown you code that presents a graphical grid, plus the plot() function that “draws” pixels in the grid. These are the basic building blocks you need to do graphics in text mode. The next step is to craft functions that create basic geometric shapes. The most basic of those is the line.
A line is defined by two points. It connects the two points in the shortest distance possible in two dimensions.
The traditional computer graphics line() function takes at least four arguments: Position x1, y1 for one point on the line, and position x2, y2 for the other point. Additional arguments may set the line’s width, color, style, and so on, but basically two points are specified and the line is plotted betwixt them.
The formula for plotting a line goes back to that High School algebra class you slept through:
y = mx + b
Where y is a function of the slope, m, by the corresponding x position. Value b is the vertical axis intercept.
The most difficult part of converting the line equation into C code is the slope calculation. You’ll also discover — especially if you were coding this function on your own — that some conditions exist where the slope becomes undefined. I’ll burn that bridge when I come to it.
To calculate the slope, you need to know the change between the y coordinates and x coordinates. That is, what’s the difference between y1 and y2 as well as x1 and x2. The slope is the ratio of that change in y over the change in x.
In Figure 1, you see two coordinates plotted in a Cartesian grid, (-4,3) and (3,-5). The equivalent line() function is also shown.
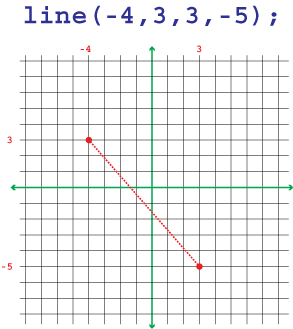
Figure 1. A line is plotted.
To calculate the slope, or the difference between the starting and ending points on the Y axis, you take the ratio of the differences with respect to the y and x coordinates, as shown in Figure 2.
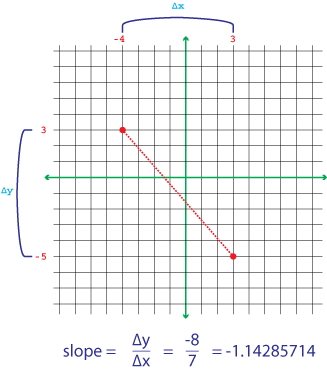
Figure 2. The slope calculation is made.
From Figure 2, you see that the slope is -8/7, or -1.14285714. That’s a negative slope, which means the line falls from left to right. A positive slope means the line rises from left to right.
To code this concept, create a loop that crawls from position x1 to x2, plotting values from y1 to y2 by modifying the y values with the slope. This solution is presented in the following code.
#include <stdio.h>

#define WIDTH 60
#define HEIGHT 20
#define X WIDTH/2
#define Y HEIGHT/2
#define XMAX WIDTH-X-1
#define XMIN -(WIDTH-X)
#define YMAX HEIGHT-Y
#define YMIN -(HEIGHT-Y)+1

char grid[HEIGHT][WIDTH];

int line(int x1, int y1, int x2, int y2);
int plot(int x, int y);
void init_grid(void);
void show_grid(void);

int main()
{
    init_grid();
    line(-4,3,3,-5);
    show_grid();

    return(0);
}

/* draw a line from point x1,y1 to x2,y2 */
int line(int x1, int y1, int x2, int y2)
{
    int x,deltaY,deltaX;
    float slope,y;

    /* Calculate the slope */
    deltaY=(Y-y1)-(Y-y2);       /* Calculate using absolute */
    deltaX=(X+x2)-(X+x1);       /*  coordinates */
    slope=(float)deltaY/(float)deltaX;

    /* Plot the points on the line */
    x = x1;
    y = (float)y1;
    while( x!=x2 && (int)y!=y2)
    {
        plot(x,(int)y);
        y += slope;
        if( x1 < x2 )
            x++;
        if( x1 > x2 )
            x--;
    }
    return(1);
}

/* Set "pixel" at specific coordinates */
int plot(int x, int y)
{
    if( x > XMAX || x < XMIN || y > YMAX || y < YMIN )
        return(-1);

    grid[Y-y][X+x] = '*';
    return(1);
}

/* Initialize grid */
void init_grid(void)
{
    int x,y;

    for(y=0;y<HEIGHT;y++)
        for(x=0;x<WIDTH;x++)
            grid[y][x] = ' ';
    /* draw the axis */
    for(y=0;y<HEIGHT;y++)
        grid[y][X] = '|';
    for(x=0;x<WIDTH;x++)
        grid[Y][x] = '-';
    grid[Y][X] = '+';
}

/* display grid */
void show_grid(void)
{
    int x,y;

    for(y=0;y<HEIGHT;y++)
    {
        for(x=0;x<WIDTH;x++)
            putchar(grid[y][x]);
        putchar('\n');
    }
}
The basic skeleton for this code was presented in last week’s Lesson. The line() function, dwelling between Lines 29 and 52, is what’s new.
Lines 35 through 37 calculate the slope. The change in y and x are calculated using absolute coordinates: Remember that the grid can have both positive and negative values.
In Line 41, y is initialized as a floating point value. It could be an int, but text mode lines are crude. Therefore, the float calculation is used for more drawing precision.
The while loop at Line 42 plots the line. Lines 46 and 48 handle the situation when the starting coordinates might not always be the leftmost coordinate.
Figure 3 displays the result as shown on my terminal.
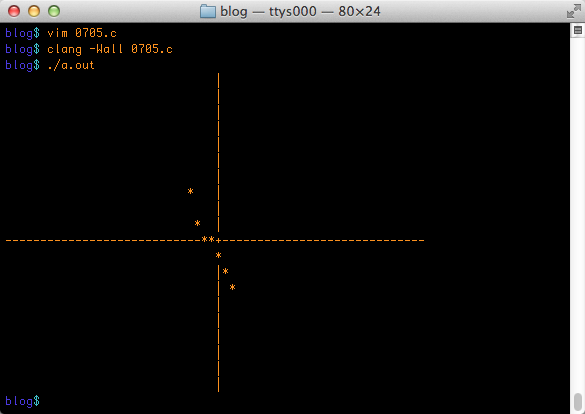
Figure 3. A lovely text mode graphical line.
Feel free to plug in other values for the line() function in this code. See whether you can discover which two conditions throw the function. If not, I’ll be covering them next Lesson.