The key to unlocking this month’s Exercise is not to go insane on the code that processes the solution. As I wrote in the Exercise post, with data analysis in C, it’s important to properly represent the data so that you can easily manipulate it.
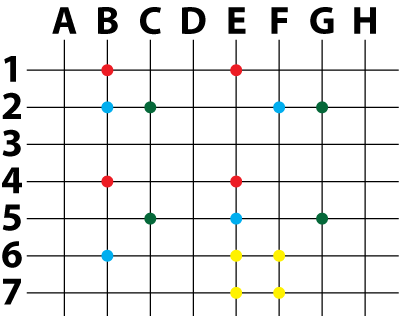
As a review, the Exercise is to examine four data sets, each of which lists four coordinates in column-row pairs. Rows are numbered. Columns are lettered. Here are the four data sets:
Data set 0: B2, B6, F2, E5
Data set 1: B1, B4, E1, E4
Data set 2: C2, C5, G2, G5
Data set 3: E6, E7, F6, F7
Figure 1 illustrates how these coordinates plot out in a grid.

Figure 1. The data set coordinates plotted on a grid (color-coded).
My first approach was to represent the coordinates as string values. So I created four char pointer arrays:
char *dataset0[4] = { "B2", "B6", "F2", "E5" };
char *dataset1[4] = { "B1", "B4", "E1", "E4" };
char *dataset2[4] = { "C2", "C5", "G2", "G5" };
char *dataset3[4] = { "E6", "E7", "F6", "F7" };
I could have created a single, multi-dimensional array, but that proved to be too unwieldy in the code as it involved those nasty ** pointer things. Even the above solution involved lots of pointers and extra manipulation required to extrapolate the data. In fact, that was the biggest problem: Getting the dataset into a manipulatable format.
My second approach was to use structures to hold the coordinates. I used this nested structure:
struct coordinates {
	char column;
	int row;
};
struct dataset {
	struct coordinates upper_left;
	struct coordinates lower_left;
	struct coordinates upper_right;
	struct coordinates lower_right;
};
The dataset is declared as follows:
struct dataset square[4] = {
	{ {'B',2}, {'B',6}, {'F',2}, {'E',5} },
	{ {'B',1}, {'B',4}, {'E',1}, {'E',4} },
	{ {'C',2}, {'C',5}, {'G',2}, {'G',5} },
	{ {'E',6}, {'E',7}, {'F',6}, {'F',7} }
};
While the mechanics of the solution worked much the same, the code using the structure was far more readable than the code using strings.
For both my solutions, the code features three functions:
main() declares the dataset and passes it to the examine() function.
examine() displays the dataset. It calls the calculate() function to determine whether the dataset represents points that plot a square. The value returned, TRUE or FALSE, is examined and the results displayed.
calculate() extrapolates the distance between the coordinates. It stores the distances in four int variables: top, bottom, left, and right. The function calculates the “distance” between the variables and returns TRUE or FALSE based on the results.
Just to show you the difference in my code between pointers and structures, here is my first attempt at assigning distances when using pointers:
top = *(*(ds+2)+0) - *(*(ds+0)+0);
bottom = *(*(ds+3)+0) - *(*(ds+1)+0);
left = *(*(ds+1)+1) - *(*(ds+0)+1);
right = *(*(ds+3)+1) - *(*(ds+2)+1);
Here is the same process when using a structure, as done in my second attempt:
top = s->upper_right.column - s->upper_left.column;
bottom = s->lower_right.column - s->lower_left.column;
left = s->lower_left.row - s->upper_left.row;
right = s->lower_right.row - s->upper_right.row;
A non-programmer may find both examples equally bewildering. My observation is that the second one is not only to be prettier but far more readable.
Click here to view my first solution (pointers).
Click here to view my second solution (structures).
As usual, your solution need not be exactly the same as mine. For both my solutions, the output was the same:
Examining data set: B2 B6 F2 E5
	Coordinates do not plot a square
Examining data set: B1 B4 E1 E4
	Coordinates plot a square
Examining data set: C2 C5 G2 G5
	Coordinates do not plot a square
Examining data set: E6 E7 F6 F7
	Coordinates plot a square